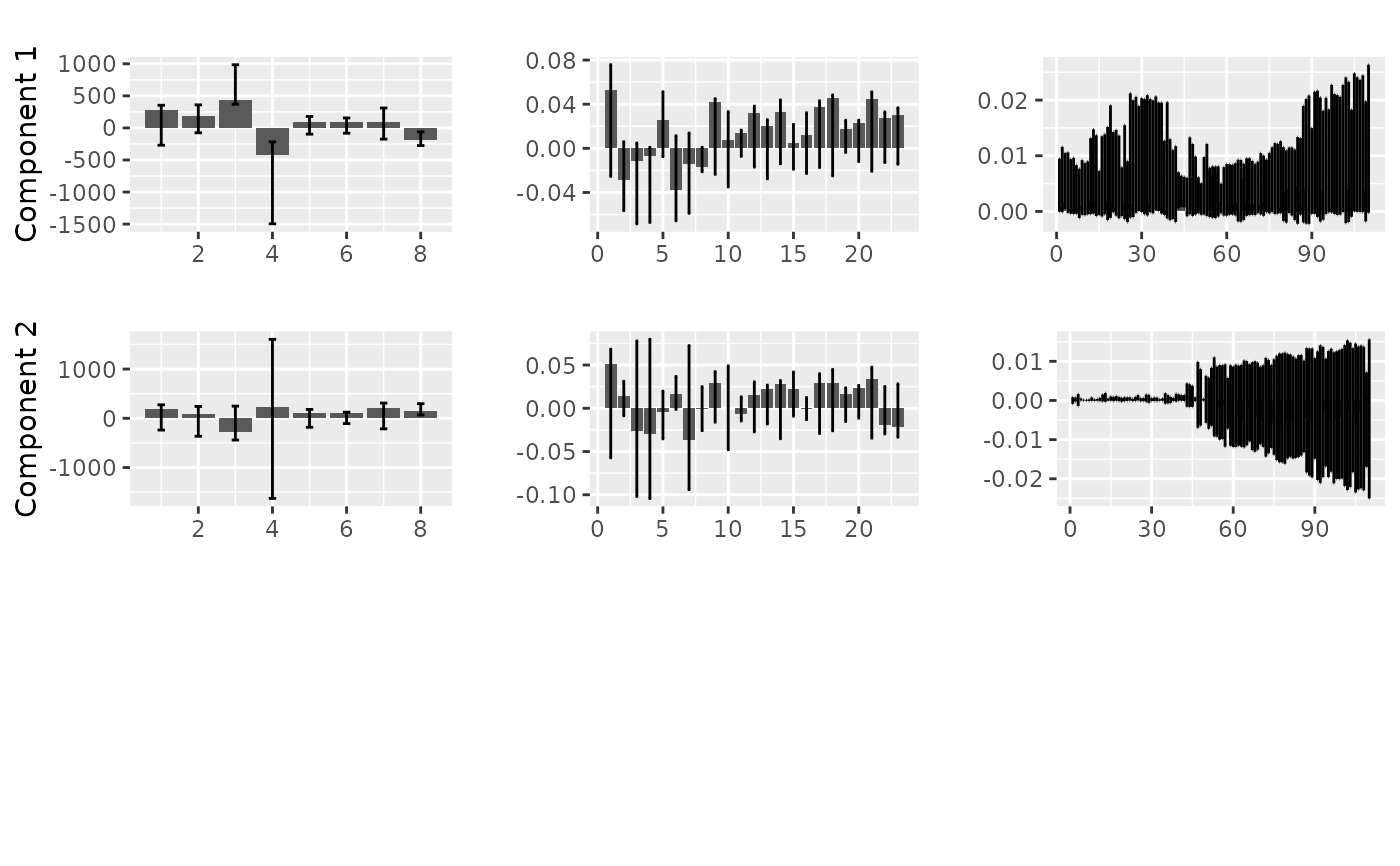
Plot a summary of the loadings of many initialized parafac models.
Source:R/plotModelStability.R
plotModelStability.RdPlot a summary of the loadings of many initialized parafac models.
Usage
plotModelStability(
  models,
  dataset,
  colourCols = NULL,
  legendTitles = NULL,
  xLabels = NULL,
  legendColNums = NULL,
  arrangeModes = NULL,
  continuousModes = NULL,
  overallTitle = ""
)
Arguments
- models
Models list output from
parafac()using output="all".- dataset
A longitudinal microbiome dataset, ideally processed with
processDataCube(), formatted as follows:- data
Array object of the data cube
- mode1
Dataframe with all the subject metadata, ordered the same as the rows in the data cube.
- mode2
Taxonomic classification of the microbiota, ordered the same as the columns in the data cube.
- mode3
Dataframe with the time metadata, ordered the same as the third dimension in the array.
- colourCols
Vector of strings stating which column names should be factorized for colours per mode.
- legendTitles
Vector of strings stating the legend title per mode.
- xLabels
Vector of strings stating the x-axis labels per mode.
- legendColNums
Vector of integers stating the desired number of columns for the legends per mode.
- arrangeModes
Vector of boolean values per mode, stating if the loadings should be arranged according to colourCols (TRUE) or not (FALSE).
- continuousModes
Vector of boolean values per mode, stating if the loadings should be plotted as a line plot (TRUE) or a bar plot (FALSE).
- overallTitle
Overall title of the plot.
Examples
processedFujita = processDataCube(Fujita2023, sparsityThreshold=0.99, centerMode=1, scaleMode=2)
models = parafac(processedFujita$data, 2, nstart=10, output="all")
plotModelStability(models, processedFujita)