Plot diagnostics of many initialized PARAFAC models.
Usage
plotModelMetric(
  metric,
  plottingMode = "box",
  ylabel = "metric",
  titleString = ""
)
Arguments
- metric
Matrix of metrics per initialized model (number of models x number of components).
- plottingMode
Plot the metrics as a box plot ("box", default) or as a bar plot ("bar").
- ylabel
String of the y axis label (default "metric").
- titleString
String of the plot title (default "").
Value
A plot of the metrics
Examples
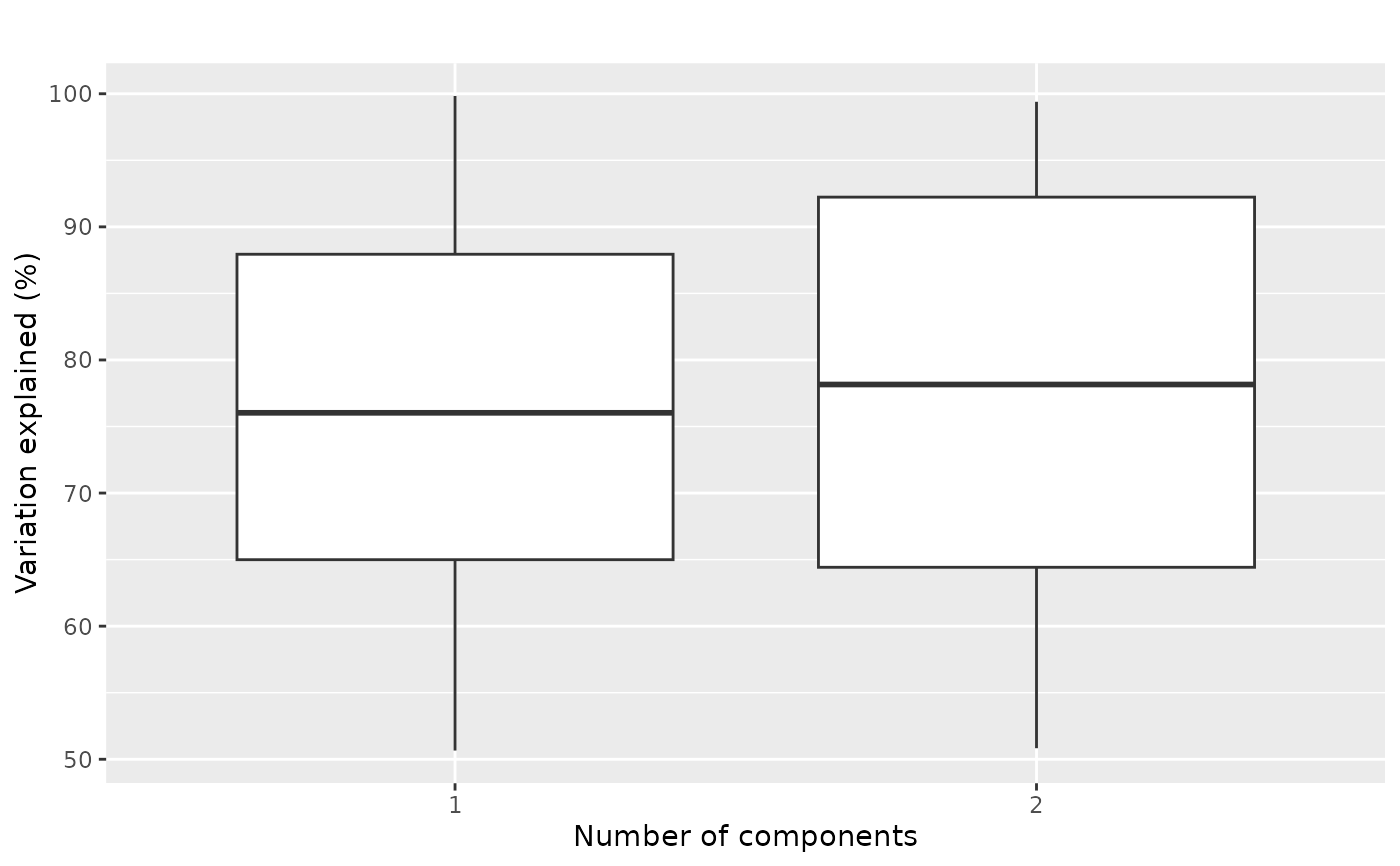
varExp = array(runif(100*2, min=50, max=100), c(100,2))
plotModelMetric(varExp, plottingMode="box", ylabel="Variation explained (%)")